Each card is one fleet region's view of the whole public catalog: the median (p50), p95 and p99 response time over the latest hour, the 7-day baseline, and the last 24 hours as a line. A region reads slower than usual only after three consecutive hours well over its baseline; the rule is stated below. Read as a feed: Atom; as data: JSON.
Right now, by region
US-East
Normal- Median (p50)
- 314 ms
- p95
- 982 ms
- p99
- 1844 ms
- Typical (7-day)
- 296 ms (1.1x)
US-West
Normal- Median (p50)
- 332 ms
- p95
- 1248 ms
- p99
- 1935 ms
- Typical (7-day)
- 326 ms (1x)
Europe
Normal- Median (p50)
- 247 ms
- p95
- 891 ms
- p99
- 1785 ms
- Typical (7-day)
- 251 ms (1x)
Asia-Pacific
Normal- Median (p50)
- 498 ms
- p95
- 1458 ms
- p99
- 2364 ms
- Typical (7-day)
- 496 ms (1x)
US-Central
Normal- Median (p50)
- 328 ms
- p95
- 1285 ms
- p99
- 1978 ms
- Typical (7-day)
- 330 ms (1x)
Canada
Normal- Median (p50)
- 348 ms
- p95
- 1123 ms
- p99
- 1801 ms
- Typical (7-day)
- 347 ms (1x)
UK
Normal- Median (p50)
- 282 ms
- p95
- 964 ms
- p99
- 2005 ms
- Typical (7-day)
- 278 ms (1x)
Southeast Asia
Normal- Median (p50)
- 656 ms
- p95
- 1779 ms
- p99
- 2439 ms
- Typical (7-day)
- 662 ms (1x)
Australia
Normal- Median (p50)
- 662 ms
- p95
- 1832 ms
- p99
- 2839 ms
- Typical (7-day)
- 696 ms (1x)
South America
Normal- Median (p50)
- 600 ms
- p95
- 1702 ms
- p99
- 2561 ms
- Typical (7-day)
- 604 ms (1x)
Latest hourly buckets as of Oct 8, 2026. Refreshed every five minutes from the hourly rollup.
Last 30 days, daily
- US-East
- US-West
- Europe
- Asia-Pacific
- US-Central
- Canada
- UK
- Southeast Asia
- Australia
- South America
| Day (UTC) | US-East p50 / p95 | US-West p50 / p95 | Europe p50 / p95 | Asia-Pacific p50 / p95 | US-Central p50 / p95 | Canada p50 / p95 | UK p50 / p95 | Southeast Asia p50 / p95 | Australia p50 / p95 | South America p50 / p95 |
|---|---|---|---|---|---|---|---|---|---|---|
| 2026-10-08 | 310 / 988 ms | 328 / 1357 ms | 242 / 903 ms | 496 / 1412 ms | 341 / 1280 ms | 343 / 1188 ms | 278 / 908 ms | 664 / 1778 ms | 671 / 1913 ms | 616 / 1759 ms |
| 2026-10-07 | 295 / 957 ms | 327 / 1411 ms | 261 / 976 ms | 500 / 1435 ms | 338 / 1335 ms | 336 / 1263 ms | 270 / 868 ms | 657 / 1825 ms | 684 / 1916 ms | 594 / 1731 ms |
| 2026-10-06 | 298 / 991 ms | 322 / 1313 ms | 249 / 934 ms | 505 / 1441 ms | 341 / 1329 ms | 371 / 1282 ms | 282 / 914 ms | 652 / 1767 ms | 697 / 1905 ms | 597 / 1694 ms |
| 2026-10-05 | 307 / 949 ms | 330 / 1359 ms | 252 / 897 ms | 493 / 1410 ms | 330 / 1265 ms | 351 / 1229 ms | 280 / 887 ms | 656 / 1816 ms | 712 / 1933 ms | 613 / 1665 ms |
| 2026-10-04 | 296 / 909 ms | 329 / 1319 ms | 249 / 873 ms | 503 / 1440 ms | 329 / 1323 ms | 348 / 1205 ms | 275 / 866 ms | 657 / 1788 ms | 689 / 1928 ms | 642 / 1807 ms |
| 2026-10-03 | 288 / 925 ms | 325 / 1321 ms | 253 / 926 ms | 487 / 1404 ms | 328 / 1217 ms | 347 / 1196 ms | 275 / 875 ms | 666 / 1842 ms | 687 / 1916 ms | 638 / 1789 ms |
| 2026-10-02 | 285 / 890 ms | 323 / 1373 ms | 251 / 946 ms | 476 / 1448 ms | 321 / 1171 ms | 352 / 1262 ms | 283 / 897 ms | 673 / 1809 ms | 732 / 2005 ms | 588 / 1638 ms |
| 2026-10-01 | 294 / 951 ms | 331 / 1371 ms | 253 / 918 ms | 496 / 1434 ms | 330 / 1233 ms | 338 / 1189 ms | 301 / 928 ms | 706 / 1825 ms | 672 / 1940 ms | 612 / 1621 ms |
| 2026-09-30 | 301 / 859 ms | 331 / 1100 ms | 250 / 849 ms | 517 / 1459 ms | 343 / 1139 ms | 359 / 1046 ms | 288 / 844 ms | 714 / 1830 ms | 721 / 1934 ms | 636 / 1684 ms |
| 2026-09-29 | 306 / 846 ms | 342 / 1072 ms | 260 / 871 ms | 509 / 1423 ms | 321 / 1025 ms | 363 / 997 ms | 296 / 826 ms | 768 / 1932 ms | 706 / 1848 ms | 620 / 1628 ms |
| 2026-09-28 | 302 / 819 ms | 351 / 1071 ms | 265 / 859 ms | 503 / 1397 ms | 332 / 1000 ms | 353 / 984 ms | 296 / 838 ms | 794 / 2062 ms | 718 / 1857 ms | 617 / 1589 ms |
| 2026-09-27 | 295 / 811 ms | 341 / 938 ms | 260 / 826 ms | 525 / 1432 ms | 345 / 989 ms | 357 / 983 ms | 303 / 828 ms | 827 / 2104 ms | 751 / 1929 ms | 631 / 1613 ms |
| 2026-09-26 | 302 / 814 ms | 368 / 1077 ms | 264 / 842 ms | 516 / 1414 ms | 352 / 1023 ms | 364 / 978 ms | 300 / 842 ms | 829 / 2093 ms | 745 / 1907 ms | 605 / 1578 ms |
| 2026-09-25 | 291 / 835 ms | 357 / 1089 ms | 269 / 871 ms | 507 / 1390 ms | 340 / 1047 ms | 374 / 1008 ms | 311 / 840 ms | 860 / 2045 ms | 714 / 1853 ms | 621 / 1615 ms |
| 2026-09-24 | 312 / 980 ms | 340 / 1094 ms | 271 / 916 ms | 513 / 1416 ms | 360 / 1094 ms | 370 / 1027 ms | 324 / 897 ms | 802 / 2183 ms | 724 / 1865 ms | 612 / 1614 ms |
| 2026-09-23 | 308 / 918 ms | 320 / 978 ms | 260 / 889 ms | 508 / 1417 ms | 349 / 1096 ms | 347 / 983 ms | 293 / 845 ms | 877 / 2294 ms | 705 / 1821 ms | 590 / 1550 ms |
| 2026-09-22 | 288 / 814 ms | 352 / 1063 ms | 265 / 903 ms | 511 / 1422 ms | 338 / 1044 ms | 358 / 979 ms | 294 / 823 ms | 868 / 2129 ms | 717 / 1759 ms | 595 / 1546 ms |
| 2026-09-21 | 275 / 823 ms | 341 / 1035 ms | 269 / 914 ms | 509 / 1456 ms | 324 / 1066 ms | 350 / 987 ms | 273 / 842 ms | 762 / 2042 ms | 747 / 1899 ms | 626 / 1538 ms |
| 2026-09-20 | 284 / 825 ms | 331 / 941 ms | 254 / 863 ms | 502 / 1371 ms | 333 / 1071 ms | 336 / 992 ms | 232 / 770 ms | 675 / 1660 ms | 736 / 1797 ms | 624 / 1573 ms |
| 2026-09-19 | 295 / 815 ms | 331 / 927 ms | 251 / 848 ms | 503 / 1370 ms | 333 / 1077 ms | 345 / 974 ms | 232 / 761 ms | 653 / 1613 ms | 728 / 1789 ms | 647 / 1673 ms |
| 2026-09-18 | 313 / 908 ms | 318 / 988 ms | 250 / 868 ms | 509 / 1503 ms | 329 / 1028 ms | 352 / 997 ms | 233 / 781 ms | 671 / 1672 ms | 713 / 1842 ms | 613 / 1576 ms |
| 2026-09-17 | 332 / 942 ms | 331 / 1048 ms | 254 / 871 ms | 508 / 1538 ms | 340 / 1026 ms | 358 / 1007 ms | 237 / 792 ms | 638 / 1591 ms | 717 / 1809 ms | 639 / 1822 ms |
| 2026-09-16 | 326 / 922 ms | 327 / 1020 ms | 243 / 867 ms | 489 / 1575 ms | 340 / 985 ms | 348 / 971 ms | 222 / 774 ms | 644 / 1558 ms | 737 / 1820 ms | 611 / 1592 ms |
| 2026-09-15 | 275 / 832 ms | 285 / 901 ms | 237 / 871 ms | 471 / 1565 ms | 346 / 976 ms | 348 / 939 ms | 225 / 732 ms | 636 / 1555 ms | 695 / 1814 ms | 613 / 1620 ms |
| 2026-09-14 | 263 / 833 ms | 232 / 794 ms | 234 / 836 ms | 475 / 1530 ms | 344 / 1012 ms | 352 / 891 ms | 223 / 726 ms | 618 / 1540 ms | 740 / 1824 ms | 569 / 1526 ms |
| 2026-09-13 | 259 / 838 ms | 217 / 776 ms | 239 / 835 ms | 464 / 1491 ms | 348 / 1005 ms | 371 / 892 ms | 224 / 731 ms | 647 / 1554 ms | 747 / 1810 ms | 601 / 1534 ms |
| 2026-09-12 | 262 / 831 ms | 222 / 773 ms | 241 / 837 ms | 497 / 1544 ms | 363 / 957 ms | 363 / 898 ms | 230 / 732 ms | 651 / 1569 ms | 723 / 1796 ms | 599 / 1505 ms |
| 2026-09-11 | 269 / 857 ms | 225 / 783 ms | 241 / 856 ms | 491 / 1590 ms | 346 / 1000 ms | 340 / 893 ms | 225 / 740 ms | 652 / 1648 ms | 727 / 1829 ms | 589 / 1517 ms |
| 2026-09-10 | 268 / 849 ms | 226 / 798 ms | 245 / 898 ms | 495 / 1591 ms | 339 / 1024 ms | 344 / 910 ms | 228 / 764 ms | 627 / 1574 ms | 729 / 1804 ms | 593 / 1552 ms |
| 2026-09-09 | 265 / 831 ms | 221 / 800 ms | 227 / 825 ms | 500 / 1591 ms | 347 / 1021 ms | 356 / 927 ms | 220 / 729 ms | 633 / 1569 ms | 740 / 1831 ms | 582 / 1575 ms |
What this is, and is not
Every figure on this page is a percentile of response times our own probes measured from 10 named fleet regions (US-East, US-West, Europe, Asia-Pacific, US-Central, Canada, UK, Southeast Asia, Australia, South America) against the public, unauthenticated endpoints of the 192 services in our public outage catalog. It is a picture of how the internet looked from each vantage point, not a reading of any one service.
Not customer traffic. Customer monitoring data never enters this aggregate: the job reads one table, the catalog's own raw probe results, and nothing else. There is nothing to anonymize because nothing private goes in.
Only successful readings (HTTP 2xx with a recorded latency) count; failed and filtered readings carry no response time worth aggregating. Hourly and daily buckets under the sample floor are left out rather than drawn. A region reads slower than usual only after 3 consecutive hours with a median above 1.5x its 7-day baseline, and clears on the first hour at or under 1.25x, so a region hovering around the line does not flap. The 7-day baseline is the median of the region's hourly medians over the 7 days before the hour being judged.
The observatory's record begins Aug 8, 2026 (61 days). Hourly buckets are kept for 90 days and daily buckets indefinitely. The words “typical for a region” are used on this page; the same claim guard that gates our research section decides. Methodology in force: version v2-2026-08-22.
Embed or cite
The daily chart and a per-region badge are plain SVG, cacheable and hotlinkable from anywhere, with “Source: RealUptime” and this page's address drawn into the picture. Link back to https://realuptime.io/outages/internet-weather when you quote a figure.
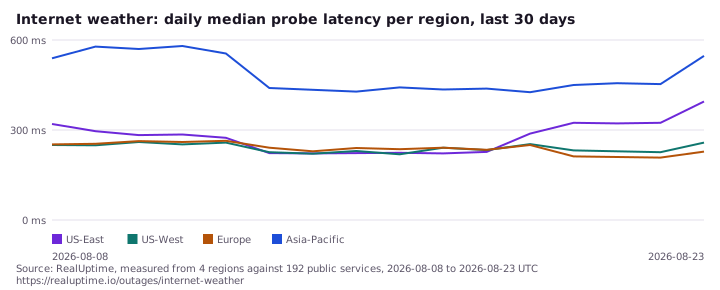
<a href="https://realuptime.io/outages/internet-weather"><img src="https://realuptime.io/outages/internet-weather/chart.svg?kind=daily" alt="Internet weather by region, RealUptime" width="720" height="290"></a>


<a href="https://realuptime.io/outages/internet-weather"><img src="https://realuptime.io/outages/internet-weather/chart.svg?kind=badge®ion=iad" alt="US-East internet weather, RealUptime" height="34"></a>